As governments worldwide rethink the role of universities in driving growth, innovation, and social mobility, higher education budgets have become a revealing indicator of national priorities. From countries that dominate global rankings through sheer economic scale to those that invest heavily relative to their GDP, the global funding landscape exposes sharp contrasts. India, positioned between ambition and constraint, offers a telling case of how scale, policy choices, and long-term vision shape the future of higher education.
By Deepali Dhuliya
Global spending on higher education is a critical indicator of a nation’s commitment to human capital development, innovation, and long-term economic resilience. It reflects not only economic capacity but also political priorities, demographic pressures, and strategic investments in knowledge economies.
In an era of rapid technological change and global competition, higher education funding supports research, skill-building, and social mobility. According to recent reports from organizations like UNESCO, the World Bank, and the OECD, total global education spending has increased steadily over the past decade, but per-child or per-student allocations have stagnated or declined in many regions due to population growth and economic constraints.
For higher education specifically, funding trends reveal a divide: wealthier nations invest heavily in research and quality, while emerging economies focus on access and expansion.
There is no single authoritative ranking of the “top ten” countries by higher education budgets, as metrics vary between absolute terms, per-student spending, and shares of GDP. However, datasets from UNESCO, the World Bank, and OECD highlight consistent leaders in tertiary education funding.
In absolute terms, the United States dominates global higher education expenditure, driven by its vast economy and a hybrid model of public and private funding.
In 2021, U.S. spending on higher education institutions reached approximately $74.7 billion in research and development alone, with total postsecondary expenditures exceeding $700 billion when including operational costs, endowments, and grants. This includes significant private investments from tuition fees, alumni donations, and corporate partnerships, alongside federal and state subsidies. The U.S. spends about $37,400 per full-time-equivalent (FTE) postsecondary student, more than double the OECD average of $18,400. This high investment fuels world-class research universities like Harvard and Stanford, fostering innovation ecosystems in sectors such as technology and biotechnology.
However, challenges persist, including rising student debt and debates over affordability, with public funding per student declining in real terms in some states.
China ranks second in absolute spending, with higher education investments surging due to its economic scale and national priorities.
In 2018, China’s higher education R&D expenditure was $34.7 billion, and total tertiary funding has grown rapidly, supported by initiatives like the Double First-Class University Plan. By 2024, China’s overall education budget approached $900 billion, with a significant portion allocated to higher education to build global competitiveness in fields like artificial intelligence and engineering. Unlike the U.S., China’s model is predominantly state-driven, with lower per-student spending (around $5,000-10,000) but massive enrollment—over 40 million students—reflecting priorities in basic education and infrastructure alongside higher ed.
Following these giants are European powerhouses like Germany, the United Kingdom, France, and Japan, which consistently rank high in absolute higher education funding. Germany’s federal and state governments spent €188.8 billion on education in 2023, with a substantial share for higher education, including tuition-free public universities and robust research funding.
In 2021, Germany’s higher education R&D alone was $24.8 billion. The UK’s system, blending public grants with student fees, allocated £145.9 billion to education in 2022, supporting research-intensive institutions like Oxford and Cambridge. France and Japan follow suit, with expenditures of $14 billion and $19.8 billion on higher ed R&D, respectively, emphasizing public systems and innovation. These countries benefit from strong public commitments, with higher education often viewed as a driver of economic stability and export-oriented industries.
When measured as a share of GDP or per student, smaller but education-focused nations excel. Norway leads with 1.8% of GDP on higher education in 2022, followed by Denmark (1.7%), Finland (1.6%), and Sweden (1.5%).
These Nordic countries treat higher education as a public good, offering free tuition and generous student support, resulting in high enrollment rates and strong outcomes in innovation and social mobility. Australia and Canada also rank highly, with per-student spending of around $20,000-25,000, supported by international student fees and public investments. For instance, Canada’s tertiary attainment rate is the world’s highest at 65% among working-age adults, reflecting sustained funding. These nations prioritize equity, with funding models that link resources to performance metrics like graduation rates and research output.
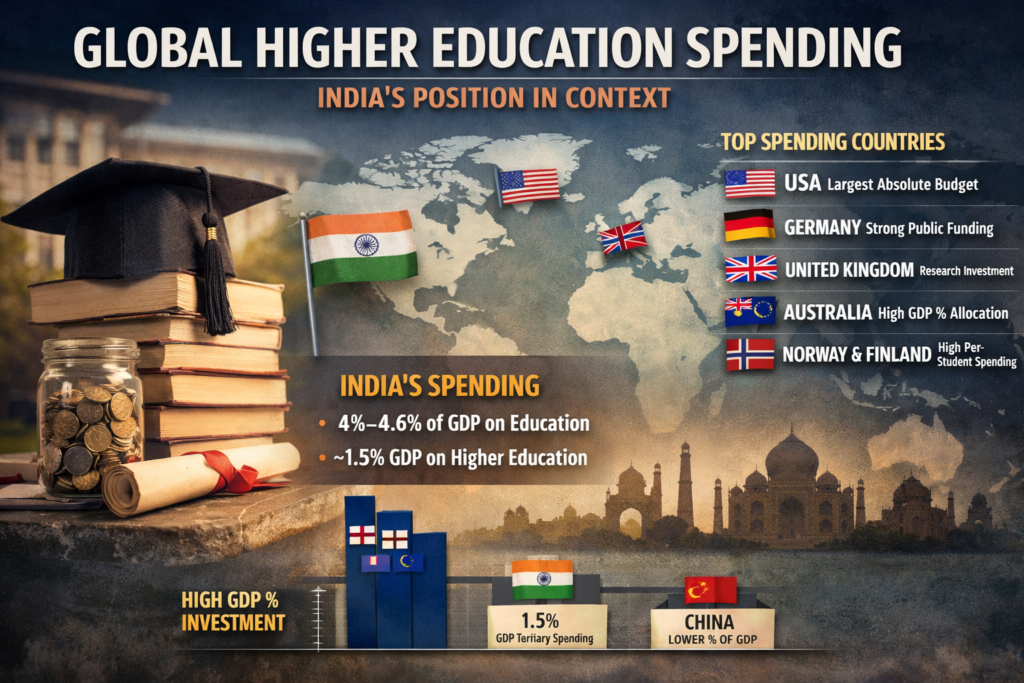
India’s position in this global landscape is unique, marked by ambition amid constraints. India does not rank in the top ten for absolute higher education spending, with total education expenditure at around ₹1.28 lakh crore ($15.4 billion) in the 2025-26 Union Budget.
However, as a share of GDP, India’s overall education spending hovers between 4.1% and 4.6% from 2015-2024, aligning with UNESCO’s recommended 4-6% benchmark. Specifically for higher education, estimates place it at 1.5-1.57% of GDP, higher than some Asian peers like China (0.16% for R&D share) but below OECD averages. The combined Centre and states expenditure on universities and higher education is 0.62% of GDP, plus 0.95% on technical education. This places India ahead of countries like Nigeria (0.38%) but behind BRICS peers such as South Africa (6%) and Brazil (5.6%).
India’s challenges stem from scale and distribution rather than outright commitment. With over 1,000 universities and 45 million students—the world’s second-largest system—funds are spread thin, with per-student expenditure at roughly $400-500, far below the U.S. ($37,400) or even China.
Public funding prioritizes access and enrollment expansion under the National Education Policy (NEP) 2020, which aims for 50% gross enrollment ratio by 2035 and 6% GDP allocation overall. However, actual spending has stagnated at 2.7-3% of GDP in recent years, with higher education receiving only 0.39% from the Centre. This limits research intensity; Indian universities lag in global rankings, with only a few like IITs excelling due to targeted funding. Compared to leaders, India’s model is access-oriented, not research-heavy, leading to quality gaps and brain drain.
Global trends underscore these divides. OECD reports show enrollment grew 10% in the decade to 2022, but funding sustainability is strained by declining public subsidies, falling domestic enrollment in some countries, and volatility in international student revenues. Aid to education is projected to fall by 25% by 2027, exacerbating gaps in low-income nations. Large economies like the U.S. and China leverage scale for dominance, while smaller advanced nations like Norway lead in proportional investment, yielding superior quality outcomes.
For India to ascend, decisive shifts are needed. The NEP emphasizes multidisciplinary education, research ecosystems, and infrastructure, but meeting the 6% GDP target requires coordinated Centre-state efforts. Recent budgets show nominal increases (6.5% in 2025-26), but real growth lags inflation. Emulating Nordic models for equity or China’s focus on innovation could help. Public-private partnerships, increased R&D grants, and performance-based funding might enhance efficiency. Ultimately, India’s middle-ground status—steady commitment but low per-student investment—must evolve toward research-driven excellence to compete globally.
In summary, the global hierarchy reveals parallel realities: absolute powerhouses like the U.S. and China, proportional leaders like Norway, and emerging players like India. Bridging gaps demands not just more funds but smarter allocation, ensuring higher education drives inclusive growth. As UNESCO warns, without renewed investment, progress toward SDG 4 (quality education) risks stalling.

Top 10 Countries by Absolute Spending on Higher Education / Universities
- United States — Dominates globally with total postsecondary expenditures in the hundreds of billions USD annually (operational costs, research, grants, endowments). Higher education R&D alone reached ~$75 billion in benchmark years, far exceeding others. Hybrid public-private model (federal/state subsidies + massive tuition/endowments from institutions like Harvard, Stanford) drives this lead.
- China — Second-largest spender, with explosive growth in university funding. Higher education R&D ~$35 billion in earlier data; total tertiary budget forms part of a near-trillion-dollar overall education spend. Massive scale supports rapid rise in global rankings and STEM innovation.
- Germany — Strong public commitment to tuition-free universities and research. Higher education R&D ~$25 billion; total education spending peaks among EU nations (e.g., €175+ billion overall in recent years, with significant tertiary share).
- Japan — Invests heavily in research universities. Higher education R&D ~$20 billion; supports advanced technology and innovation sectors.
- United Kingdom — High spending on elite, research-intensive institutions (Oxford, Cambridge, Imperial). Blends public grants with student fees for substantial totals.
- France — Robust public university system with strong research emphasis. Higher education R&D ~$14 billion.
- South Korea — Prioritizes tertiary education for economic competitiveness; heavy investments in universities and innovation.
- Canada — Growing absolute spending, supported by high per-student levels and public funding.
- Australia — Significant totals boosted by international student revenues and research investments.
- India — Enters top rankings due to enormous system scale (over 45 million students, 1,000+ universities); though per-student amounts are lower, overall expenditure volume places it in contention for large-system comparisons.
These rankings draw from patterns in OECD Education at a Glance (2025 edition emphasizes tertiary financing variations), NSF/NCSES international R&D comparisons (US leads dramatically), Eurostat (high absolute totals in populous EU countries like Germany/France), and UNESCO/World Bank aggregates. Note: Absolute figures are challenging to pinpoint precisely across all countries due to differences in private funding inclusion (high in US/UK), currency adjustments, and data recency—OECD covers members well, while China/India rely on national estimates.
Top 10 Global Universities: Latest Rankings (2025-2026)
Global university rankings evaluate institutions based on factors like academic reputation, research output, employer reputation, teaching quality, international outlook, citations, industry income, and sustainability. Major sources include:
- QS World University Rankings (2026 edition, released mid-2025)
- Times Higher Education (THE) World University Rankings (2026 edition)
- US News Best Global Universities (2025-2026)
- Academic Ranking of World Universities (ARWU/Shanghai) (2025 edition)
Rankings vary slightly due to different methodologies—QS emphasizes reputation and employability, THE balances teaching/research, ARWU focuses heavily on research and Nobel/Fields prizes, while US News prioritizes research performance.
The top tier remains dominated by US and UK institutions, with strong performers from Switzerland, Singapore, and emerging rises in China.
Consensus Top 10 Global Universities (Aggregated from Major 2025-2026 Rankings)
- Massachusetts Institute of Technology (MIT) — Cambridge, United States Tops QS 2026 (score 100) and frequently #1 or #2 across lists. Renowned for innovation, STEM excellence, entrepreneurship, and high employer reputation.
- University of Oxford — Oxford, United Kingdom Holds #1 in THE 2026 (for the 10th year in some reports) and consistently top 3-5. Excels in research environment, teaching, and historic prestige.
- Harvard University — Cambridge, United States #1 in US News 2025-2026, #1 in ARWU 2025, and top 5 in others. Leads in academic reputation, alumni impact, and research volume.
- Stanford University — Stanford, United States Strong across boards (e.g., high in QS, THE, ARWU). Famous for Silicon Valley ties, innovation, and high research citations.
- University of Cambridge — Cambridge, United Kingdom Regularly top 5-7. Excels in research quality, international outlook, and historic contributions to science and humanities.
- Imperial College London — London, United Kingdom #2 in QS 2026 (major jump in recent years). Focuses on science, engineering, medicine, and business with strong industry links.
- ETH Zurich – Swiss Federal Institute of Technology — Zurich, Switzerland Top 10 staple (e.g., high in QS and ARWU). Known for engineering, technology, and Nobel laureates like Einstein.
- Princeton University — Princeton, United States Rising in THE 2026 (joint third in some highlights). Emphasizes undergraduate teaching, research, and selectivity.
- University of California, Berkeley — Berkeley, United States Frequently top 10 (e.g., #9 in THE 2026 highlights). Public research powerhouse with strengths in sciences and social sciences.
- Yale University — New Haven, United States Often rounds out the top 10 (e.g., #10 in THE 2026). Renowned for law, humanities, arts, and global alumni network.
Key Trends in 2025-2026 Rankings
- US dominance persists in the top spots, but with slight shifts (e.g., MIT and Imperial rising in QS).
- UK strength — Oxford, Cambridge, and Imperial hold firm.
- Asian rise — Chinese universities (e.g., Tsinghua, Peking) climb into top 20-40 in many lists, reflecting heavy investment in research.
- Methodology differences — ARWU favors US heavyweights (Harvard #1), while QS boosts Imperial to #2.
- No single “official” top 10 exists
About the Author
Deepali Dhuliya is a communication scholar with a degree in journalism from the University of Delhi. Her work focuses on human resource management and climate change & sustainability. She has worked at Infosys, H&M, and Zomato, where she was involved in designing and managing sustainability programmes. Her work bridges communication, organisational practice, and environmental responsibility, with a strong focus on translating sustainability goals into actionable strategies.
Acknowledgement:
The ideas, analysis and conclusions expressed in this article are solely those of the author. AI tools were used for background research and editorial support.