In an era where energy security dictates geopolitical alliances and economic fortunes, oil remains the lifeblood of the global economy. Despite the accelerating shift toward renewables, crude oil powers over a third of the world’s energy needs, fueling everything from transportation to manufacturing. But who truly controls this vital resource? A complex web of nations, corporations, and cartels holds sway over the planet’s oil reserves and production. Recent upheavals—such as U.S. involvement in Venezuela’s oil sector and ongoing OPEC+ maneuvers—have reshaped the landscape.
Newswriters News Desk
The Reserves: Buried Treasures Unevenly Distributed
Proven oil reserves represent the recoverable oil that can be extracted with current technology and under prevailing economic conditions. As of late 2025, global proven reserves stand at approximately 1.7 trillion barrels, but control is concentrated in a handful of countries. Venezuela tops the list with a staggering 303 billion barrels, largely due to its vast Orinoco Belt heavy oil deposits. However, political instability and sanctions have hampered extraction, leaving much of this potential untapped until recent developments.
Saudi Arabia follows closely with 267 billion barrels, cementing its role as the Middle East’s oil giant. The Kingdom’s reserves are not only massive but also relatively cheap to produce, giving it significant leverage in global markets. Iran holds the third spot with 208 billion barrels, though U.S. sanctions and regional tensions limit its output. Iraq and the United Arab Emirates round out the top five, with 145 billion and 113 billion barrels respectively. These Middle Eastern nations collectively control over 50% of the world’s proven reserves, a dominance that has fueled decades of geopolitical intrigue.
North America also features prominently. Canada ranks fourth globally with 163 billion barrels, primarily from Alberta’s oil sands. The United States, with about 69 billion barrels, has seen reserves grow through shale innovations, though it lags behind in sheer volume. Russia, despite Western sanctions following its 2022 invasion of Ukraine, maintains around 80 billion barrels. Emerging players like Brazil and Guyana are rising, with offshore discoveries boosting South America’s profile.
This concentration raises questions about vulnerability. Climate change policies and the energy transition could strand assets, but for now, reserves equate to power. As one analyst noted, “He who controls the reserves controls the future supply—and the prices.”
Production Powerhouses: From Wells to Wealth
Reserves are potential; production is reality. In 2025, global oil output averaged around 100 million barrels per day (bpd), with the United States leading the pack at over 21 million bpd—more than 20% of the world’s total. The U.S. shale boom, driven by fracking in the Permian Basin, has transformed it from importer to exporter, reshaping global dynamics.
Saudi Arabia, with 11 million bpd, remains the swing producer capable of flooding or tightening markets at will. Russia follows at 10.7 million bpd, defying sanctions through shadow fleets and redirected exports to Asia. Canada produces 5.7 million bpd, while China and Iraq each hover around 4-5 million bpd.
The United Arab Emirates, Iran, Brazil, and Kuwait complete the top ten, underscoring the Middle East’s production clout despite non-OPEC leaders like the U.S. and Russia.
Notably, production doesn’t always align with reserves. Venezuela, despite its top reserves, outputs only about 1 million bpd due to infrastructure decay and political turmoil. This mismatch highlights how technology, investment, and stability dictate control.
Corporate Giants: The Private Sector’s Grip
While nations own most reserves, corporations extract and distribute them. State-owned enterprises dominate, with Saudi Aramco—the world’s largest by market cap at over $1.5 trillion—controlling Saudi Arabia’s output. Aramco’s 2025 revenues exceeded $460 billion, underscoring its influence.
ExxonMobil, the U.S. heavyweight, boasts a $500 billion market cap and operates globally, from Guyana to the Arctic. Chevron, another American major, focuses on shale and LNG, with a strong presence in Asia. China’s PetroChina and CNOOC rank high, reflecting Beijing’s energy security push. European firms like Shell and BP are pivoting to renewables but still command significant oil shares.
In the U.S., ConocoPhillips and others drive domestic production, often through joint ventures. These companies wield soft power, influencing policies and markets through lobbying and investments.
OPEC+ and Collective Control
No discussion of oil control is complete without OPEC, the Organization of the Petroleum Exporting Countries, which includes 12 members like Saudi Arabia, Iraq, and the UAE. Together with allies like Russia in the OPEC+ alliance, they control about 40% of global production.
In 2025, OPEC+ extended production cuts of 2.9 million bpd into 2026 to stabilize prices amid surpluses. This strategy aims to manage stocks and maintain backwardation in futures markets.
However, internal rifts—such as Angola’s 2024 exit and debates over quotas—test unity. Demand growth slowed to 830,000 bpd in 2025, pressuring the group. OPEC’s influence waned slightly as non-OPEC supply, led by the U.S., surged.
Geopolitical Shifts: Wars, Sanctions, and New Alliances
Geopolitics amplifies control disparities. In 2025, oil markets shrugged off “black swan” events like the Israel-Iran conflict and Ukrainian strikes on Russian refineries, with premiums vanishing due to ample supply. Yet, tensions persist.
The biggest story of early 2026 is Venezuela. Following political changes, the U.S. has positioned itself to manage the world’s largest reserves, with Vice President JD Vance declaring American control over Venezuelan energy resources. This could boost global supply by 3 million bpd, but security risks from militias and economic hurdles loom. President Trump’s plan faces skepticism, yet it could reshape energy geopolitics.
Elsewhere, Russia’s rerouting of oil to India and China circumvents sanctions, while Middle Eastern volatility—exacerbated by Houthi attacks on shipping—threatens chokepoints like the Strait of Hormuz. Climate risks and trade wars add layers, with potential recessions curbing demand.
Outlook: A Precarious Balance
As 2026 unfolds, oil control remains fragmented yet interdependent. Nations like Saudi Arabia and the U.S. hold the cards, but corporations and cartels execute the plays. With prices hovering near five-year lows in late 2025, OPEC+ faces pressure to adapt. The energy transition looms, but oil’s grip endures—for now.
In this high-stakes game, control isn’t just about quantity; it’s about strategy, alliances, and foresight. As global demand evolves, the true winners will be those who navigate the shift from fossil fuels to a sustainable future.
India’s Oil Landscape: Reserves, Production, and Import Dependency

As of early 2026, India possesses modest proven crude oil reserves of approximately 4.98 billion barrels (around 4,981 million barrels per the OPEC 2025 Annual Statistical Bulletin, with a minor increase from 2023), placing the country roughly 22nd globally and accounting for less than 1% of the world’s total proven reserves of about 1,567 billion barrels.
These reserves are primarily concentrated in onshore fields (about 61%) in states like Assam, Rajasthan, and Gujarat, and offshore areas (39%) such as Mumbai High and the Krishna-Godavari basin, with ongoing exploration by ONGC targeting promising deepwater and frontier basins like Andaman and Mahanadi that could yield future additions.
However, domestic production remains limited and largely stagnant, averaging around 28-30 million metric tonnes (MMT) annually (roughly 600,000 barrels per day). In November 2025, indigenous crude oil and condensate output stood at 2.3 MMT (up 2.6% year-on-year), while refinery throughput reached 22.3 MMT, of which over 90% (approximately 20.2 MMT) was met through imports.
For the April–November period of FY 2025-26, crude imports rose 2.4% to about 163.4 MMT, pushing India’s overall oil import dependency for domestic petroleum product consumption to 88.6% (up from 88.1% the previous year). Annual imports typically exceed 230-240 MMT to support consumption of 240-250 MMT of petroleum products, driven by robust demand in transportation, industry, and petrochemicals.
Despite policy efforts to enhance exploration, increase ethanol blending to 20% in petrol, and accelerate renewables, India’s heavy reliance on imports—making it the world’s third-largest crude oil importer—leaves it exposed to global price volatility, though softer international prices (Indian basket around $60-62 per barrel in late 2025/early 2026) have helped ease the import bill in recent months.
India’s Energy Import Expenditure
In the first eight months of fiscal year 2025-26 (April-November 2025), India’s net oil and gas import bill—including crude oil, petroleum products, and liquefied natural gas (LNG)—stood at approximately $80.9 billion, representing roughly 15-16% of the country’s total merchandise imports of $515.21 billion. During the same period (with crude oil alone dominating the energy import value, often accounting for over 90% of the oil and gas bill in monthly snapshots, such as $9.7 billion out of $10 billion in June 2025, while LNG and petroleum products contribute smaller shares amid softer global prices).
Broader estimates from policy analyses and recent trends indicate that crude oil imports typically constitute about 25% of India’s total merchandise imports annually in recent years, though this proportion has moderated in FY 2025-26 due to lower international crude prices (Indian basket averaging around $67.6 per barrel) despite higher import volumes and persistent dependency of over 88% on imported crude for consumption.
The overall energy import bill (oil and gas) has historically hovered around 30-40% of total merchandise imports in high-price years, but the current fiscal period’s decline reflects a more favorable global pricing environment, easing pressure on the trade deficit even as energy remains one of India’s largest single import categories.
Rising Stars: The Growing Share of Alternative, Energy Sources Like Nuclear and Renewables
As of early 2026, alternative energy sources—encompassing renewables (such as hydro, wind, solar, bioenergy, and geothermal) alongside nuclear—continue to gain ground in the global energy landscape, particularly in electricity generation, where low-carbon options reached historic milestones in 2024 and 2025.
Renewables and nuclear together supplied two-fifths (40%) of global electricity for the first time in 2024, with renewables contributing about one-third (led by hydropower at around 14%, wind at 8%, and solar PV at 7%) and nuclear holding steady at approximately 9%.

Nuclear power achieved record-breaking generation in 2024 (around 2,667 TWh) and is on track for further highs in 2025 and beyond, driven by reactor restarts in Japan and France, new capacity in China, India, and Korea, though its share in the overall electricity mix remains stable at roughly 9% amid surging demand from electrification and data centers. Renewables, especially solar and wind, are the fastest-growing segment, with combined wind and solar shares projected to climb from 15% in 2024 to over 19% by 2026, overtaking coal in some scenarios as early as late 2025 or mid-2026 depending on hydropower conditions.
This shift underscores nuclear’s role as a reliable, dispatchable low-emissions baseload source, complementing the rapid, variable growth of renewables, while low-carbon sources as a whole exceed 40% in key periods and are poised to meet most new electricity demand through the late 2020s, accelerating the decarbonization of power systems even as fossils still dominate primary energy overall.
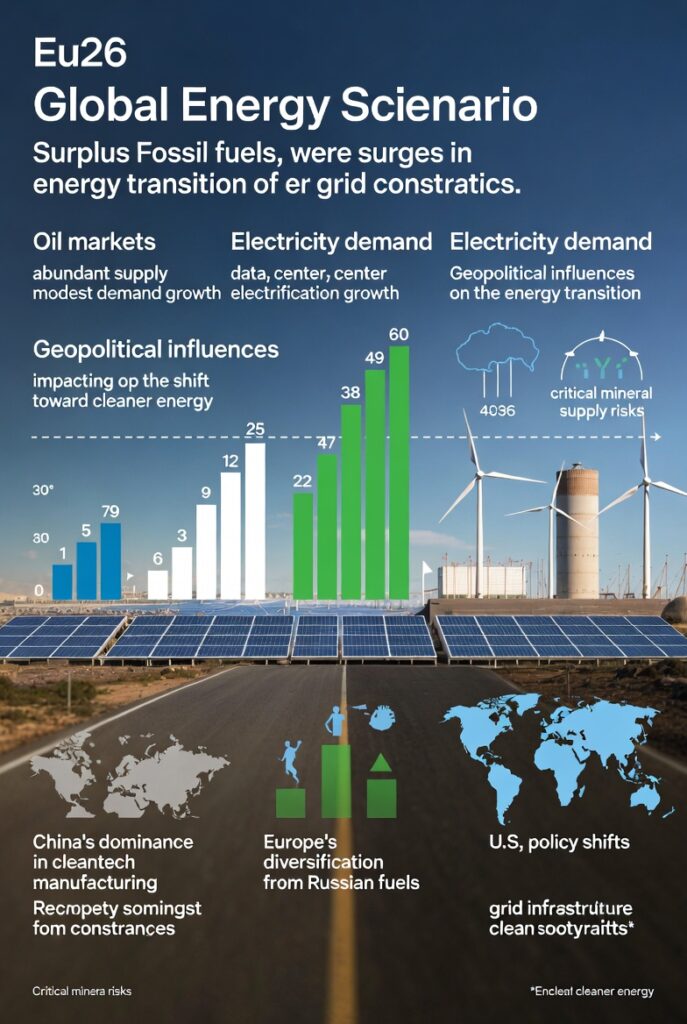
The Global Energy at Crossroads
The world stands at a defining juncture in its energy evolution: fossil fuels, despite abundant supply and softening prices, continue to underpin the global economy while clean energy technologies—particularly solar, wind, and battery storage—advance at unprecedented speed, capturing the majority of new power capacity and steadily eroding coal’s dominance in electricity generation.
Surging electricity demand from data centers, electrification, and industrial growth in Asia is being met increasingly by renewables and nuclear, yet the transition remains uneven, hampered by grid bottlenecks, critical mineral dependencies, geopolitical rivalries, and divergent national policies. While short-term fossil surpluses offer breathing room for consumers and economies, the long-term trajectory is unmistakable: clean energy is no longer a niche but the fastest-growing and increasingly cost-competitive pillar of the future energy system.
The coming years will test whether governments, industries, and investors can overcome persistent barriers to accelerate decarbonization—or whether the inertia of the old energy order delays the inevitable shift toward a more sustainable, electrified, and renewable-dominated world.